#Infographic: Are you Suffering from Facebook Fatigue? Need a Break?

Image of an infographic about fatigue from Facebook.
Do you need a break from Facebook?

If you’re like most people, a Facebook vacation may be in your future…

Facebook now has more than 1 billion users. That’s a lot. And most of us are aware the social networking site is the largest in the world. Facebook has seemingly proliferated nearly every crevice of the ‘interwebs.’ Websites are using Facebook widgets in place of the ‘traditional’ comment section, the Facebook share button sits next to nearly every blog post and most people check their Facebook news feed several times a day.

For many of us, Facebook is such a huge part of our lives that it can be hard to get away from the daily dose of friend updates, brand pages marketing their products and news about the site itself. I get made fun of for my constant social media consumption–I’m always on the hunt for articles spanning a wide array of topics just so I can share it across my networks. All this Facebook usage and consumption of updates from our online social networks can be rather taxing. Even I take a break from time-to-time. According to the infographic from onlinecollegecourses.com below, I’m not alone–61 percent of current Facebook users have taken a break from Facebook for one week or longer.

The infographic states several reasons why people feel the need to take a brief hiatus from Facebook. For me, it’s just nice to ‘unplug’ for a day or two just to clear my mind a bit. Take a look at the infographic below and let me know if you’ve taken a break from Facebook or if you plan to soon.

Facebook Fatigue Infographic

#Infographic: Is the Drop in Apple Shares a Sign of a Possible Plateau?

Image of Apple's logo in silverApple is certainly a newsworthy company. In the past few weeks, Apple released the iPad mini, the patent war between Apple and Samsung has escalated and iPhone 5S and even iPhone 6 rumors have begun circulating the Internet (only three months since the launch of the iPhone 5). Not all Apple news is positive, however. The infographic below is particularly timely given the recent tumble in Apple shares. “Peak or Plateau: What’s Next for Apple?” is certainly a good title for this infographic as the data points look at the success from Apple in recent years and considers the falling stock as the tech giant looks ahead to the future. Whether the future for Apple is gloomy or sunny, you can be certain Apple will continue making big news.

Remarkably, Apple is able to remain in the limelight incessantly while still holding out on social media. Indeed, Mashable recently had a nice write-up on four huge brands still not on social media. There Apple was, the largest company in the world, at the bottom of the list. It seems silly. For the amount of traditional advertising the company does for each new product launch, it seems like a natural next step would be to layer social media on top of that and create online communities to further push its messaging throughout the Web. Maybe social media is finally in Apple’s future?

From the looks of this infographic, Apple might need to shake things up a bit to be sure it doesn’t ‘plateau.’ As you can see Apple has gained some huge ground in the past five years. For one, the iPhone alone now has higher sales than every product Microsoft has to offer. With a $500 billion value, the company is either going to continue thriving or simply flat line. This infographic even says its fan base is leveling out. But the underlying question? Is Apple’s financial skyrocket peaking or is it merely preparing for the next big launch? Check out the infographic from onlinebusinessdegree.org below and draw your own conclusion:

Peak or Plateau: What’s Next for Apple?

#Infographic: The Impact of Social Media in the 2012 Presidential Election

With voters heading to the polls this week this infographic is rather timely. I am lucky enough to not have to suffer through too many political ads because I don’t have a TV. However, social media is part of my job and my life in general so it’s impossible to escape political posts in my Facebook news feed or in my Twitter stream. Indeed, I follow Barack Obama on both Facebook and Twitter and hardly a day goes by where I miss out on a piece of propaganda turned out from his crack digital team. I’ll admit I didn’t watch a single second of the recent presidential debates, but I basically got the gist from all the memes and post-debate online chatter.

Take a look at the infographic below to see how social media has impacted this election so far. First, a few stats that jump out at me. For one, 9 out of 10 Senators and Representatives now have a Twitter account. Of course, these accounts are mostly being run by the campaign team or other staffers, but I think this still helps to emphasize the importance of social media in the overall strategy of politicians. Other stats that really jump out at me are based on the sheer volume of Tweets this year’s election has sparked. Barack Obama inspired over 52,000 tweets per second during the 2012 DNC–4 million tweets during his 39 minute speech. The first presidential debate even saw a quarter million mentions for “Big Bird.”

After you skim through the stats below, think about how social media has played a role in shaping your opinions. Would you be voting differently without social media?

Social Media Election

Created by: Open-Site.org

Daily Deal Sites: Is the Groupon Bubble About to Pop?

Logo for daily deal site Groupon
Are the Groupon days over?

Think back for a minute to 2008 when Groupon opened shop. Can’t remember? If you’re like me, you probably don’t recall the first time you signed up to receive daily deals in your inbox–it just sort of happened. And, if you’re like me, you may have even thought “how can this type of site possibly last?” But, if you’re like me, you drank the Kool-Aid and before you knew it, you were getting Groupon emails everyday, were using the Groupon app and eventually signed up with other daily deal sites like LivingSocial or DealChicken or one of the other nearly 800 daily deal sites.

According to the infographic below, the Groupon business model is starting to crumble with one in three daily deal sites having already failed. Groupon itself has been failing pretty miserably for the last year or so. In fact, between a saturated market and retailers who claim to ‘hate’ Groupon for the small profit margins the deals bring in, Groupon could soon be history.

I think it’s pretty clear deal sites will continue to close left and right. However, I’m not so sure the end is coming as fast as this infographic claims. What do you think? Does Groupon have time to turn business around and get back in it for the long hall? Will another daily deal site rise to the top? Or is it just a matter of time before the entire ‘Groupon Bubble’ bursts?

Death of Daily Deals Infographic

Infographic by CreditScore.net

Infographic: The Internet and Social Change

The Internet has a profound power in social change. Another impressive infographic has come through my inbox and is definitely worth sharing. This one shows the true power of the Internet in bringing people together for social change. Information flows so fast these days that it can be easy to overlook or forget some of the major events powered by social media and Web broadcasting. The Internet as the public knows it is roughly two decades in and is as much a part of peoples’ lives as life itself. OK, that might be a bit dramatic, but you can definitely get a feel for how important the Internet is as a communication vehicle.

Some of the information in this graphic that really jumps out at me include the fact that a computer programmer in Pakistan tweeted about the Osama Bin Laden compound raid hours before the mainstream media reported it. More than 10 million Internet users signed an online petition opposing  the Internet censorship bill, SOPA, while another 3 million emails were sent to congress. The Internet is a true tool for social change and a vehicle for revolution. Check out the infographic below to see how the Internet plays a role in society:

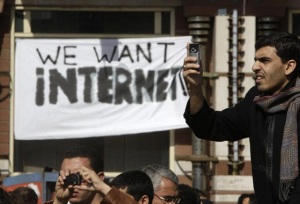
Top image credit: AP Photo/Ben Curtis via muftah.org

#Infographic: The Psychology of Social Networking Sites

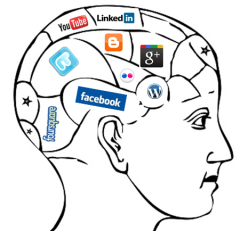
Psychology of Social MediaAnother infographic has come through my inbox that is definitely worth sharing. The folks at PsychologyDegree.net have gathered some interesting studies regarding the psychology of spending time on social networking sites. The basic assertion is that users of social networking sites are essentially narcissistic in nature. Though I would disagree it is that black and white, the infographic below does point to some interesting stats and findings.

It may be hard to argue with a finding that 80 percent of social media posts are about the poster. However, I might argue the validity of such a broad finding. It would be interesting to see how various social media platforms vary in this area. Twitter, it would seem, would yield more posts about topics of the user’s interests, but not necessarily about the poster him/herself. If you were to take into account social bookmarking sites, posts about the actual user would be almost non existent. My guess is the study was done with Facebook as the primary subject. Maybe I’m being too critical.

The last section of the infographic states that “half of all users compare themselves to others when they view photos or status updates.” That’s just human nature I suppose. What do you think? Are we obsessed with social media or are we obsessed with ourselves?

Psychology of Social Networking

Top image via http://451heat.com.

#Infographic: The Rise of Cyberbullying in the age of Technology

There’s been a lot of chatter about cyberbullying lately and this new infographic from onlinecollege.org has some amazing stats to provide insight to how technology is affecting youth. I’ll let the infographic do most of the talking, however there are a few stats worth noting.

With girls aged 14-17 sending nearly 3,000 tweets per month, there is bound to be some negative conversations now and then. Kids are now growing up in an increasingly interconnected world where using mobile technology and online social networks is commonplace. As many would agree, a problem with online communication is that people can hide behind a persona and ‘bully’ others from a distance. Indeed, 7.5 million Facebook users are under age 13 and 81 percent of today’s youth say bullying online is easier to get away with than in person.

Please take a look at the infographic below and consider the teens you know in your life, or maybe you are one:
Cyberbullying Infographic with Stats About Teen Internet Usage
Source: Accredited Online Colleges

#Infographic: What Your Life Might Look Like Without the Internet

Another infographic filled with amazing facts about the Internet is making the rounds. I was contacted by one of the creators from onlineeducation.net a couple days ago and I have started to see it posted on other sites since then (PR Daily for one).

This is an interesting infographic as it attempts to paint a picture of what life would be like without the Internet oppose to simply pointing out some key stats. Alas, there are plenty of stats that jump out at me such as the Internet directly and indirectly employing over three million people in the U.S. alone and the Internet reducing the degrees of separation down to only 3.74 people. The infographic ends with the fact that most modern day revolutions are not only aided by the Internet, but are actually started with simple Twitter hashtags such as #occupy.

Take a look below. What jumps out at you?

World without Internet
Via: OnlineEducation.net

And remember, sharing makes you smarter!

Draw Something takes the world by storm: 20 million active users in seven weeks

Draw Something: "Cowboy" by Eric Wheeler
My drawings on Draw Something have gradually gotten more detailed as the weeks have gone by.

Lately I’ve been obsessing over Draw Something. It seems I am not alone. The newest sensation in the world of smartphone apps gained 20 million active users in just a shade under two months. Available in both the iOS App Store and Android Market, Draw Something is a simple idea created by OMGPOP, which was acquired shortly after its launch by mobile gaming powerhouse Zynga for $180 million. The concept of the game is to–you guessed it–draw something for your friend. The hook is that the other player gets to watch you draw the picture in a Pictionary-style animation. Definitely a game for people of all ages.

The first few weeks I spent on Draw Something mostly consisted of stick figures and outlines of objects. With a limited, yet diverse word bank to choose from before each turn, I have expanded my skill and creativity by pushing myself to draw more detailed drawings. Some people have gone a little overboard, but there are definitely some amazing drawings floating around on the Web.

Hopefully the acquisition by Zynga will not harm the simplicity of the app as they work to further monetize off the early success of the app. I came across a clever animated infographic on Mashable earlier today and just had to share it. The folks at  MBA Online created the infographic and have gathered some staggering statistics regarding the success of Draw Something.

Draw Something

Created by: MBAOnline.com